1.7. Example Outputs
1.7.1. Damage State
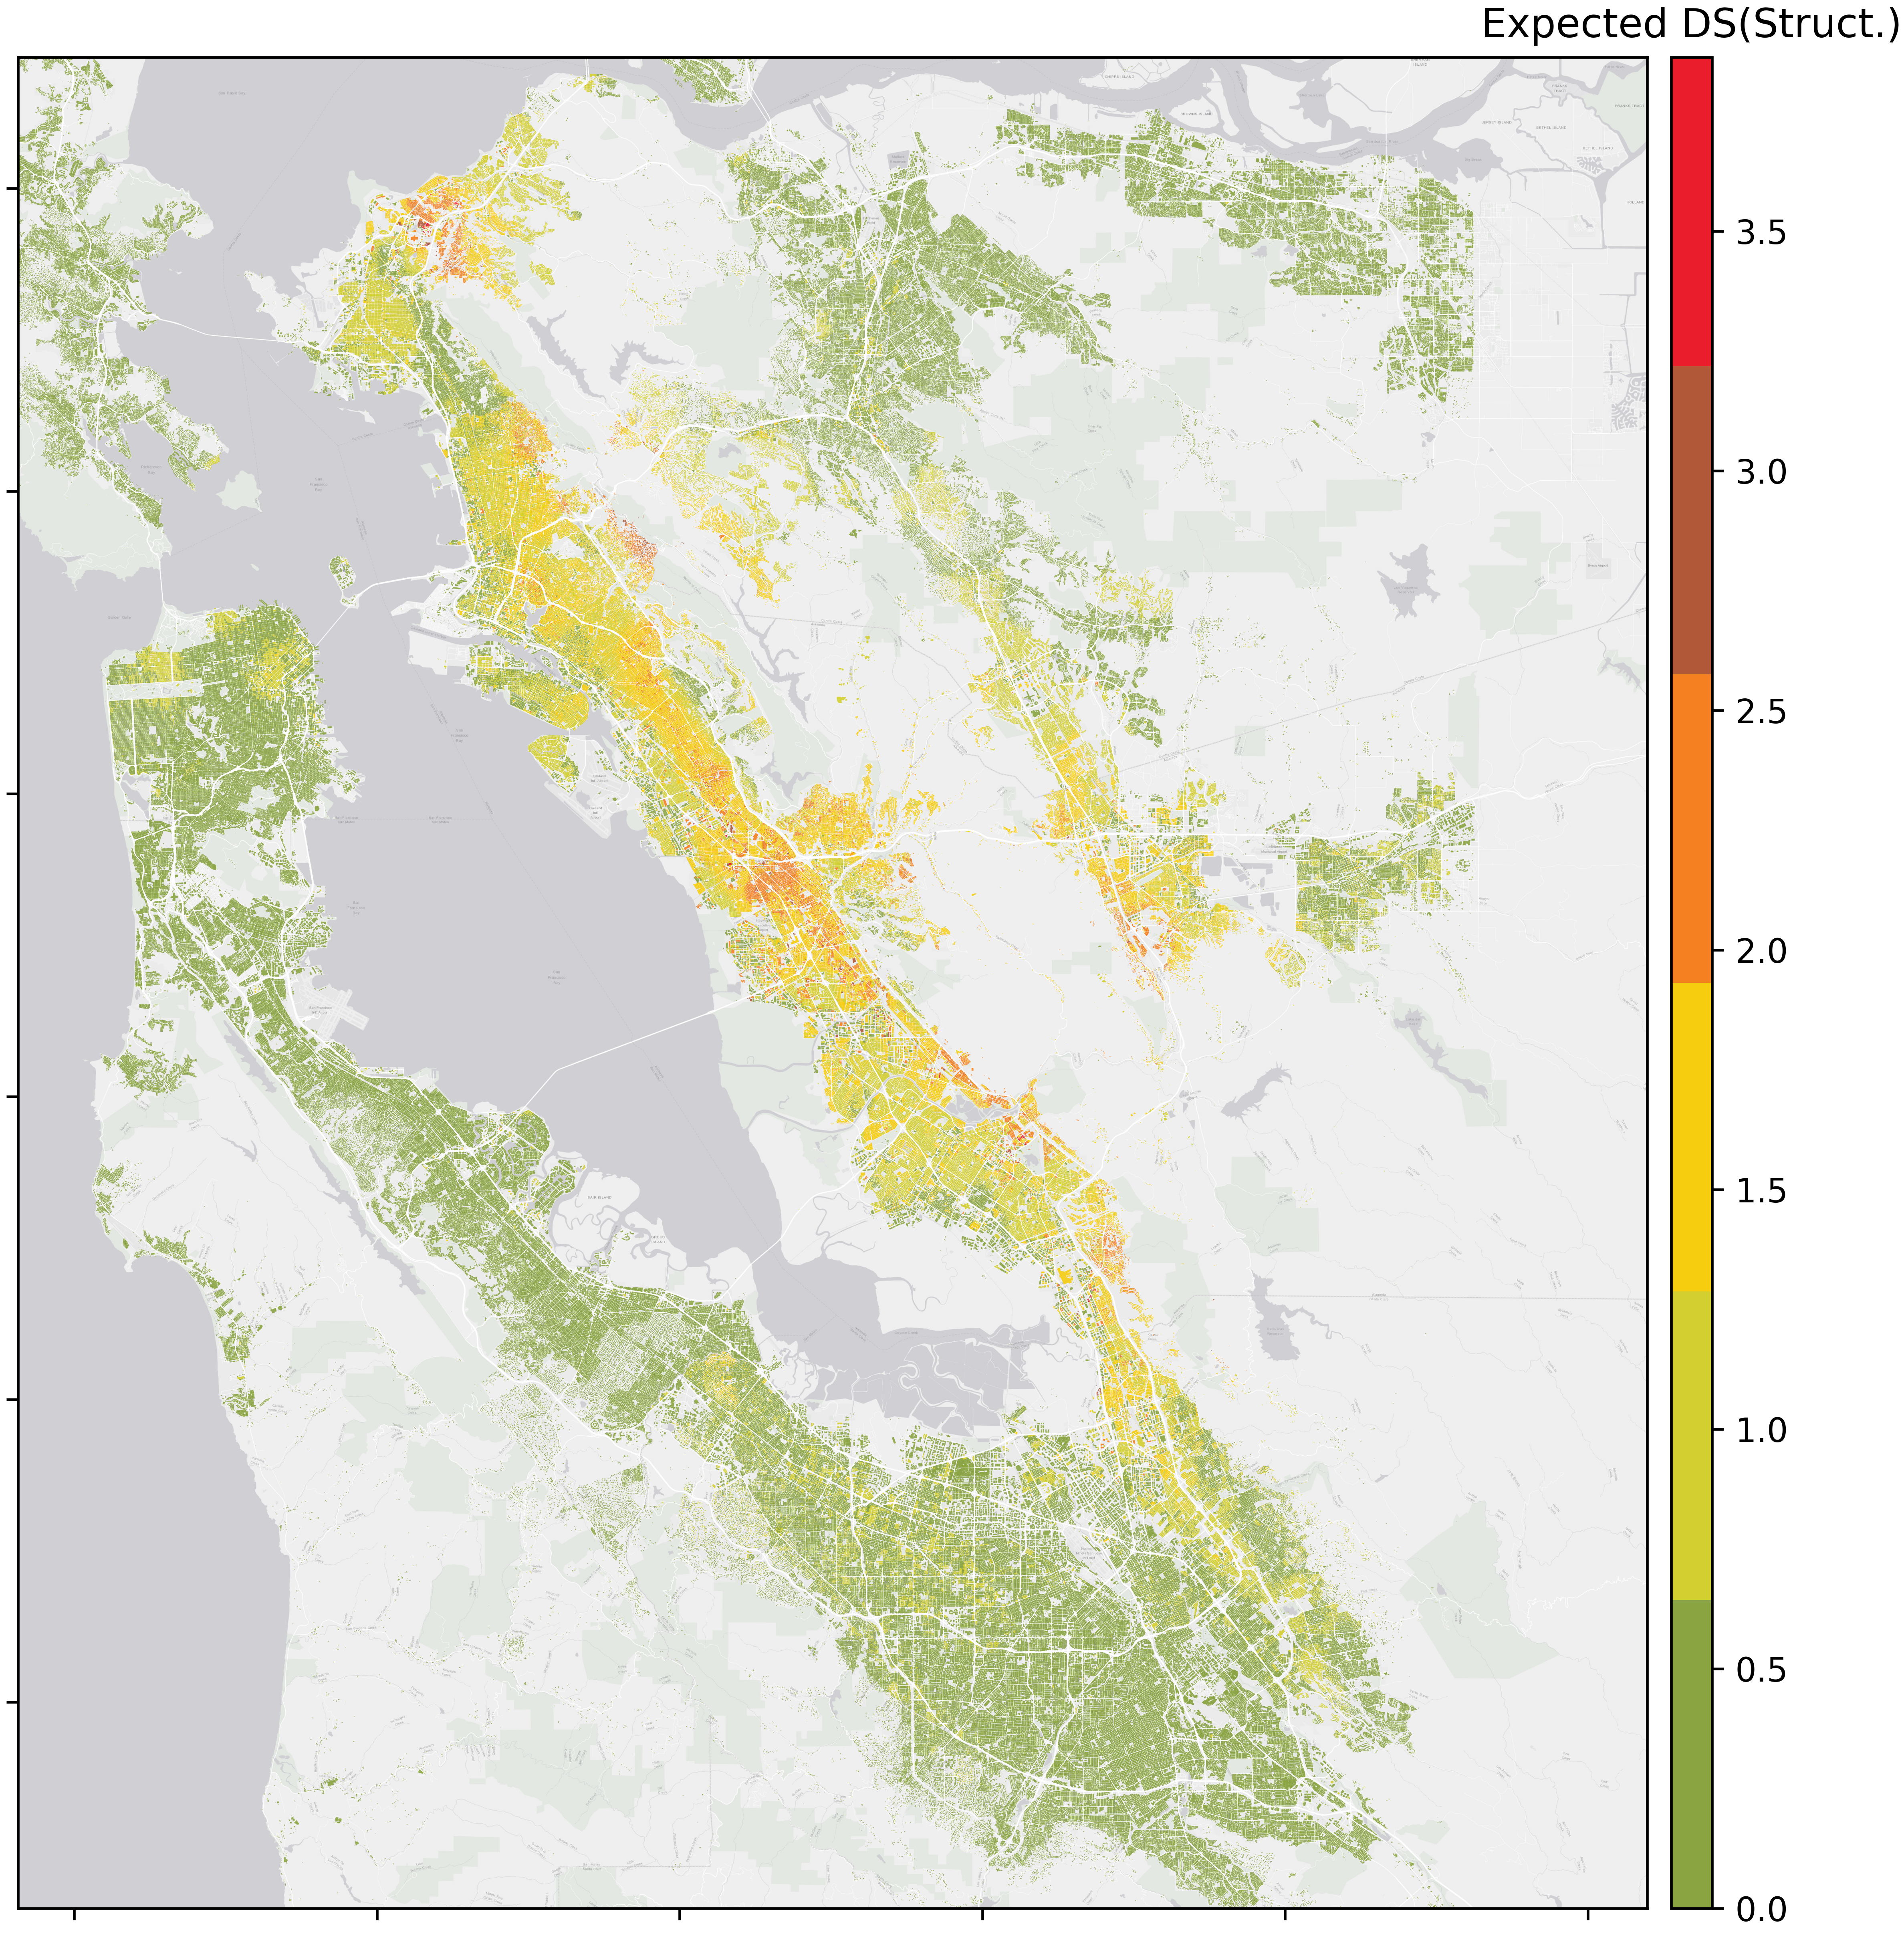
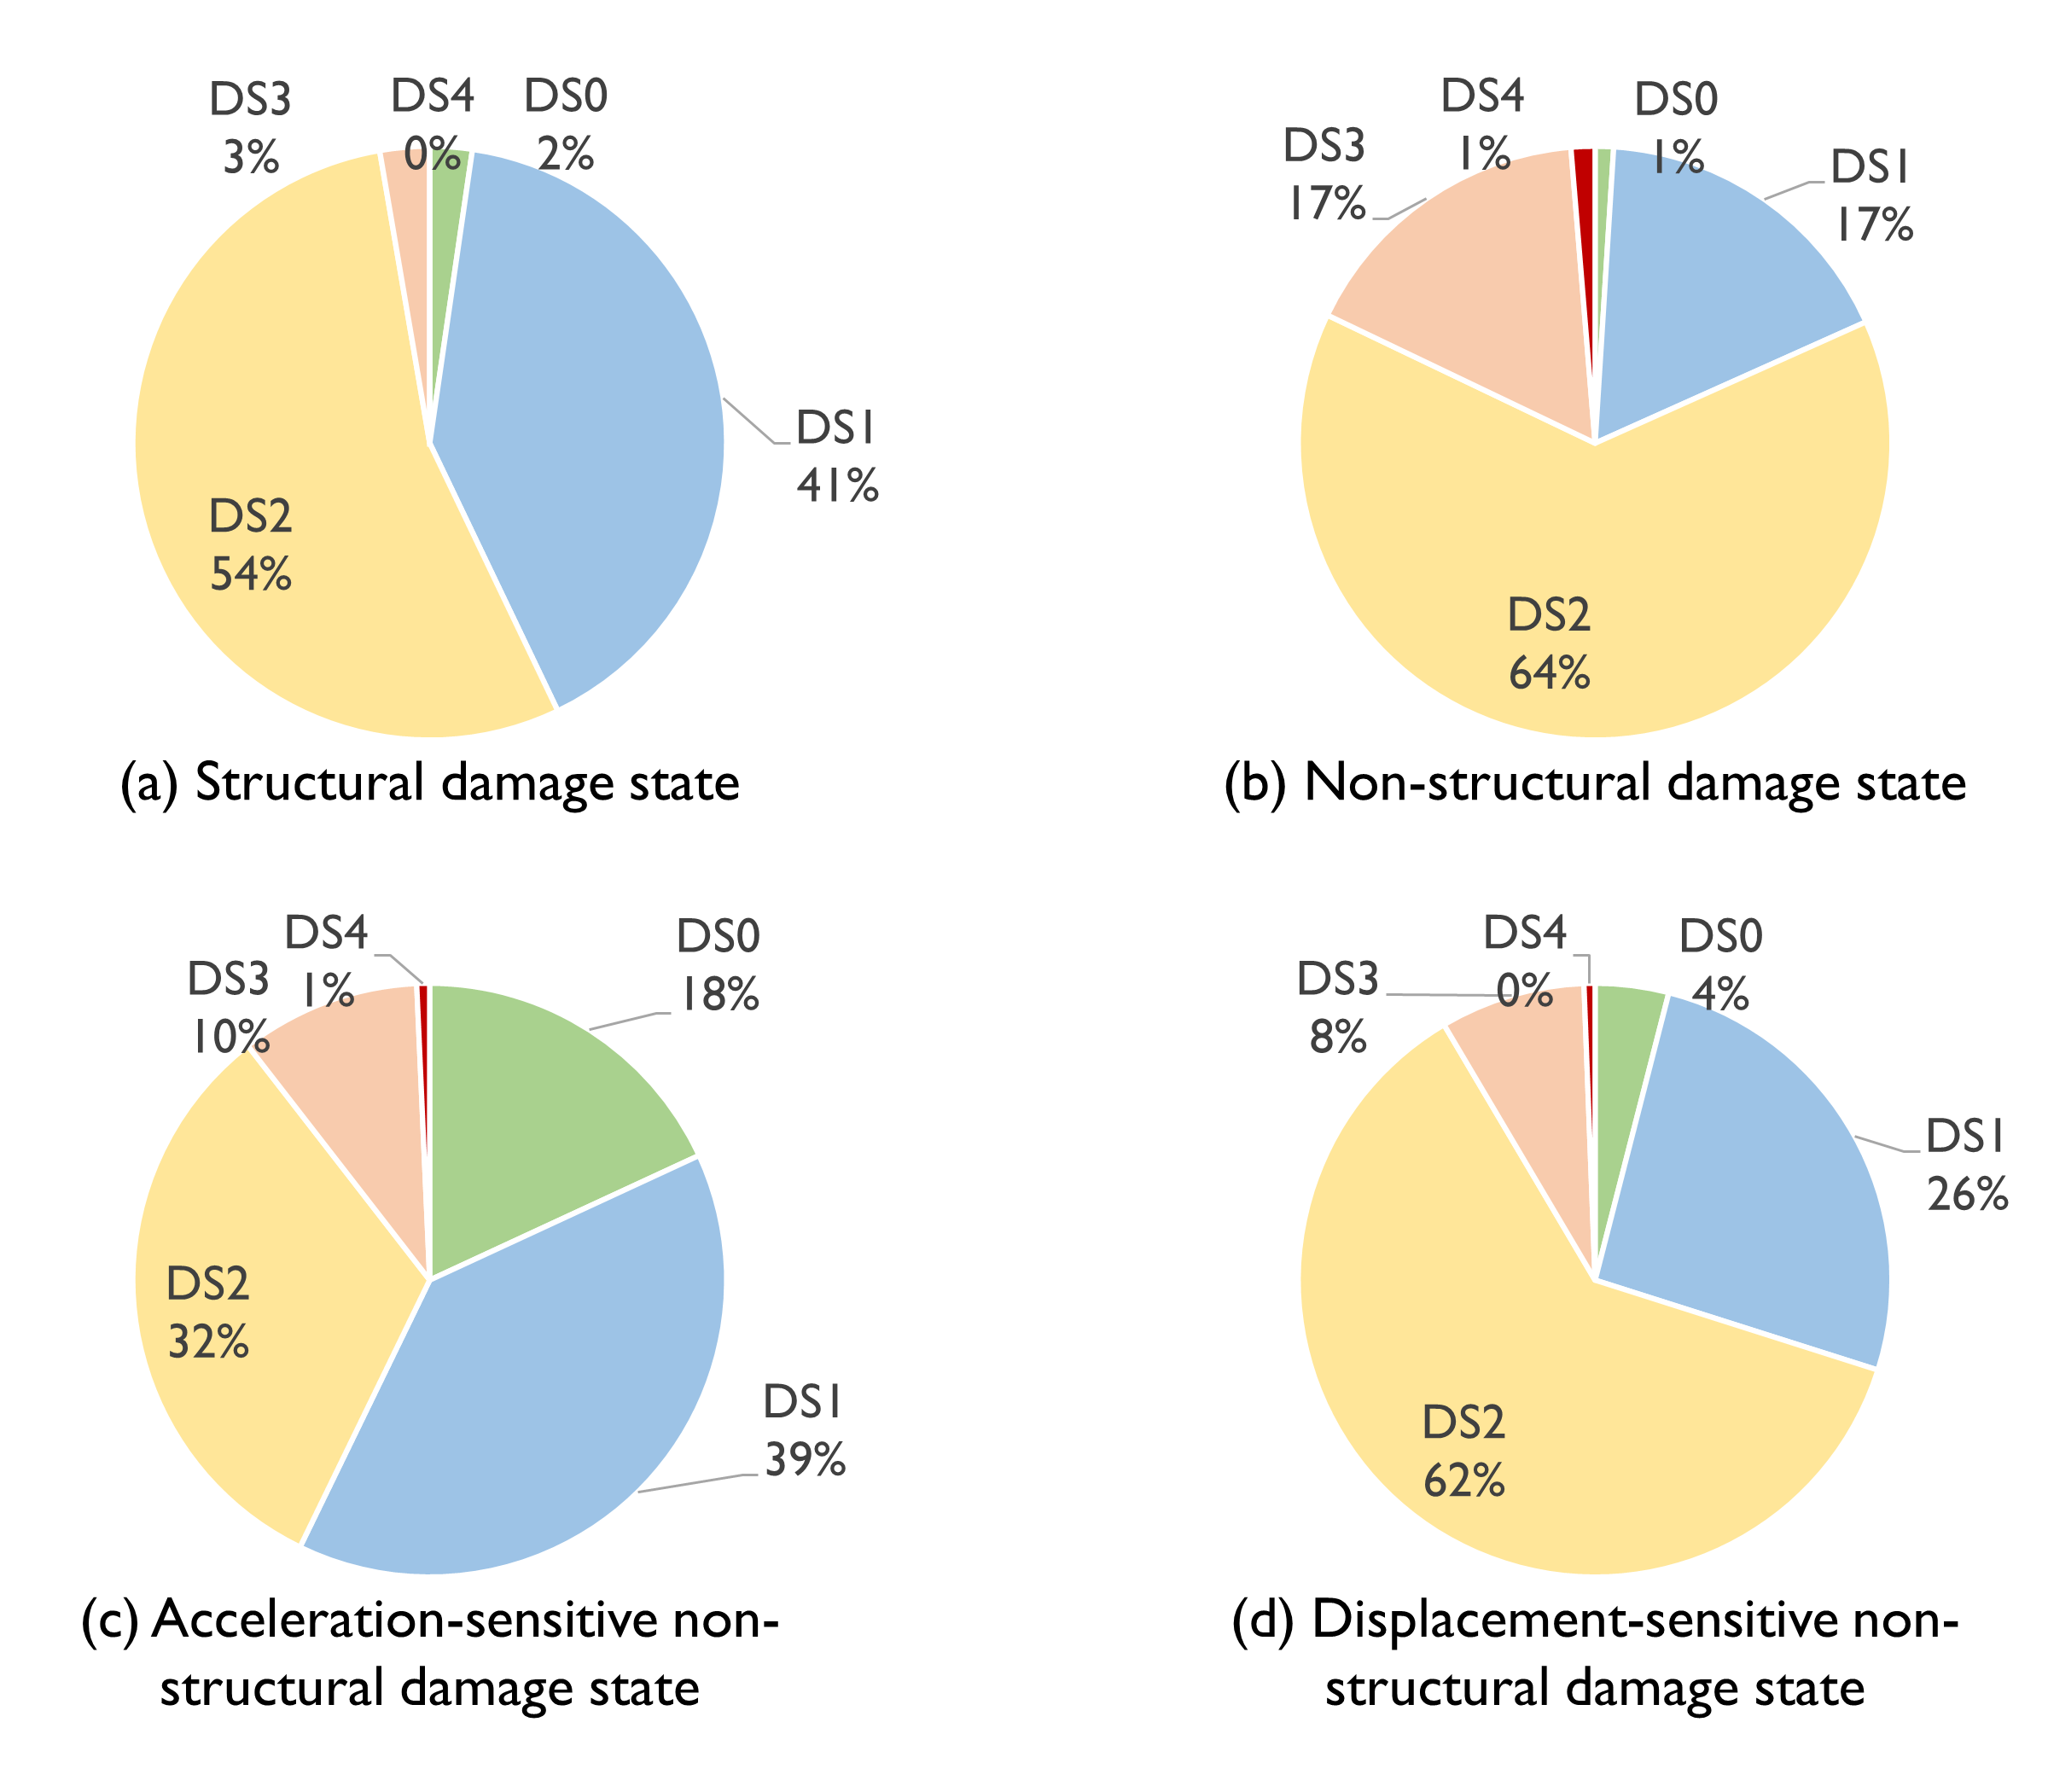
This section summarizes the resulting expected damage states of the building assets from the Hayward Earthquake. The expected damage state is computed as the weighted average over the 20,000 PELICUN realizations each of which has a predicted damage state metric, i.e., 0 (None), 1 (Slight), 2 (Moderate) , 3 (Extensive), and 4 (Complete). Fig. 1.7.1.1 shows expected structural damages which have a wide spectrum from nearly none damaged (in the South Bay regions) to Moderate/Extensive damage (in the East Bay region). Recalling the example 2-story wood frame residential building in Response Simulation, it has an expected damge state of about 1.6 with a breakdown statics: 2.3% in None (DS0), 40.6% in Slight (DS1), 54.4% in Moderate (DS3), and 2.7% in Extensive (DS4). And the building is very unlikely to collapse. Referring to Damage and Loss Estimation, this building is likely to experience plaster or gypsum-board cracks at corners of door and window openings; small diagonal cracks across shear wall panels; or/and cracks in brick chimneys or toppling of tall masonry chimneys.

Fig. 1.7.1.1 Expected structural damage states from San Francisco testbed.
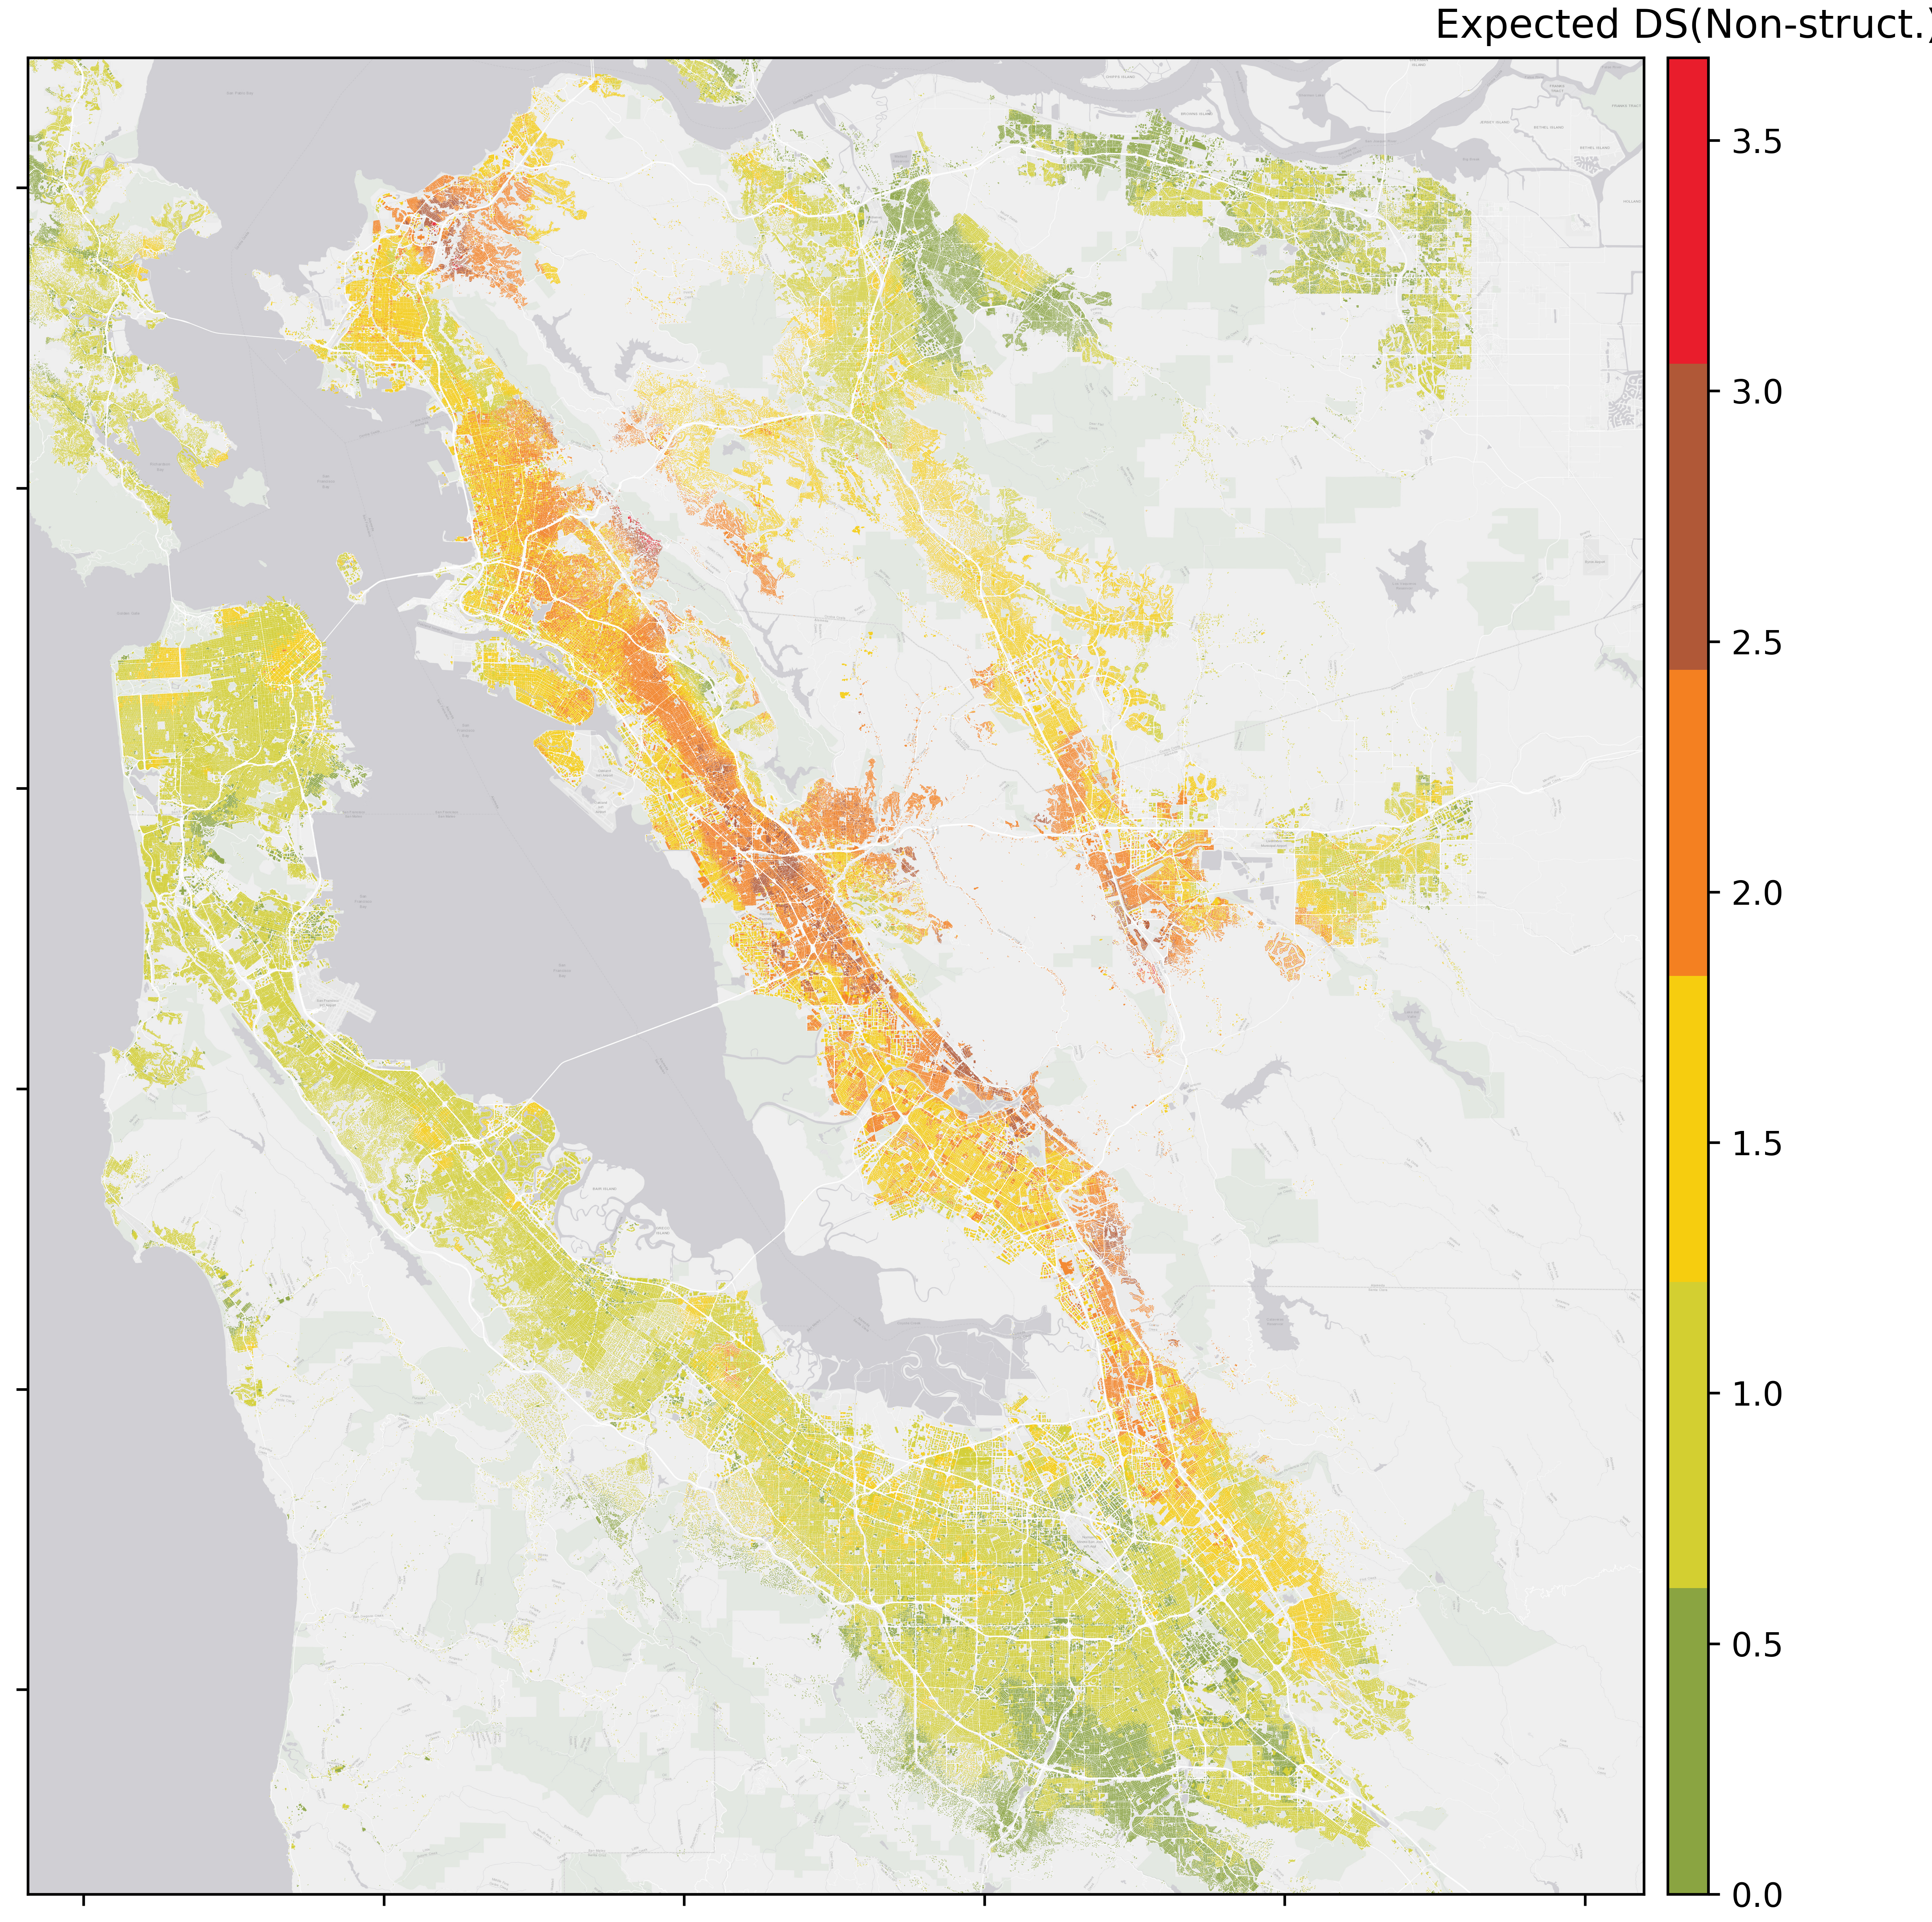
Fig. 1.7.1.2 shows expected non-structural damages which tend to be server if compared to the structural damage. For the building assets in the South Bay regions, Slight to Moderate non-structural damages are likely. Buildings located near the Hayward fault are likely to experience Moderate to Extensive non-structural damages. The example wood frame building is expected to have a Moderate damage state (DS = 2.0 with a probability of 64%). Detailed breakdown statistics are plotted in Fig. 1.7.1.3. THe building is likely to experience the following potential damages: (1) cracks requiring repair and repainting; some partitions may require replacement of gypsum board or other finishes, (2) falling of tiles, (3) connections of exterior wall panels to structural frame are damaged requiring further inspection and repairs, and (4) piping leaks occur at a few locations, elevator machinery and rails may require realignment.

Fig. 1.7.1.2 Expected non-structural damage states from San Francisco testbed.

Fig. 1.7.1.3 Structural and non-structural damage states of the example wood frame (as introduced in Response Simulation).
1.7.2. Expected Loss Ratio
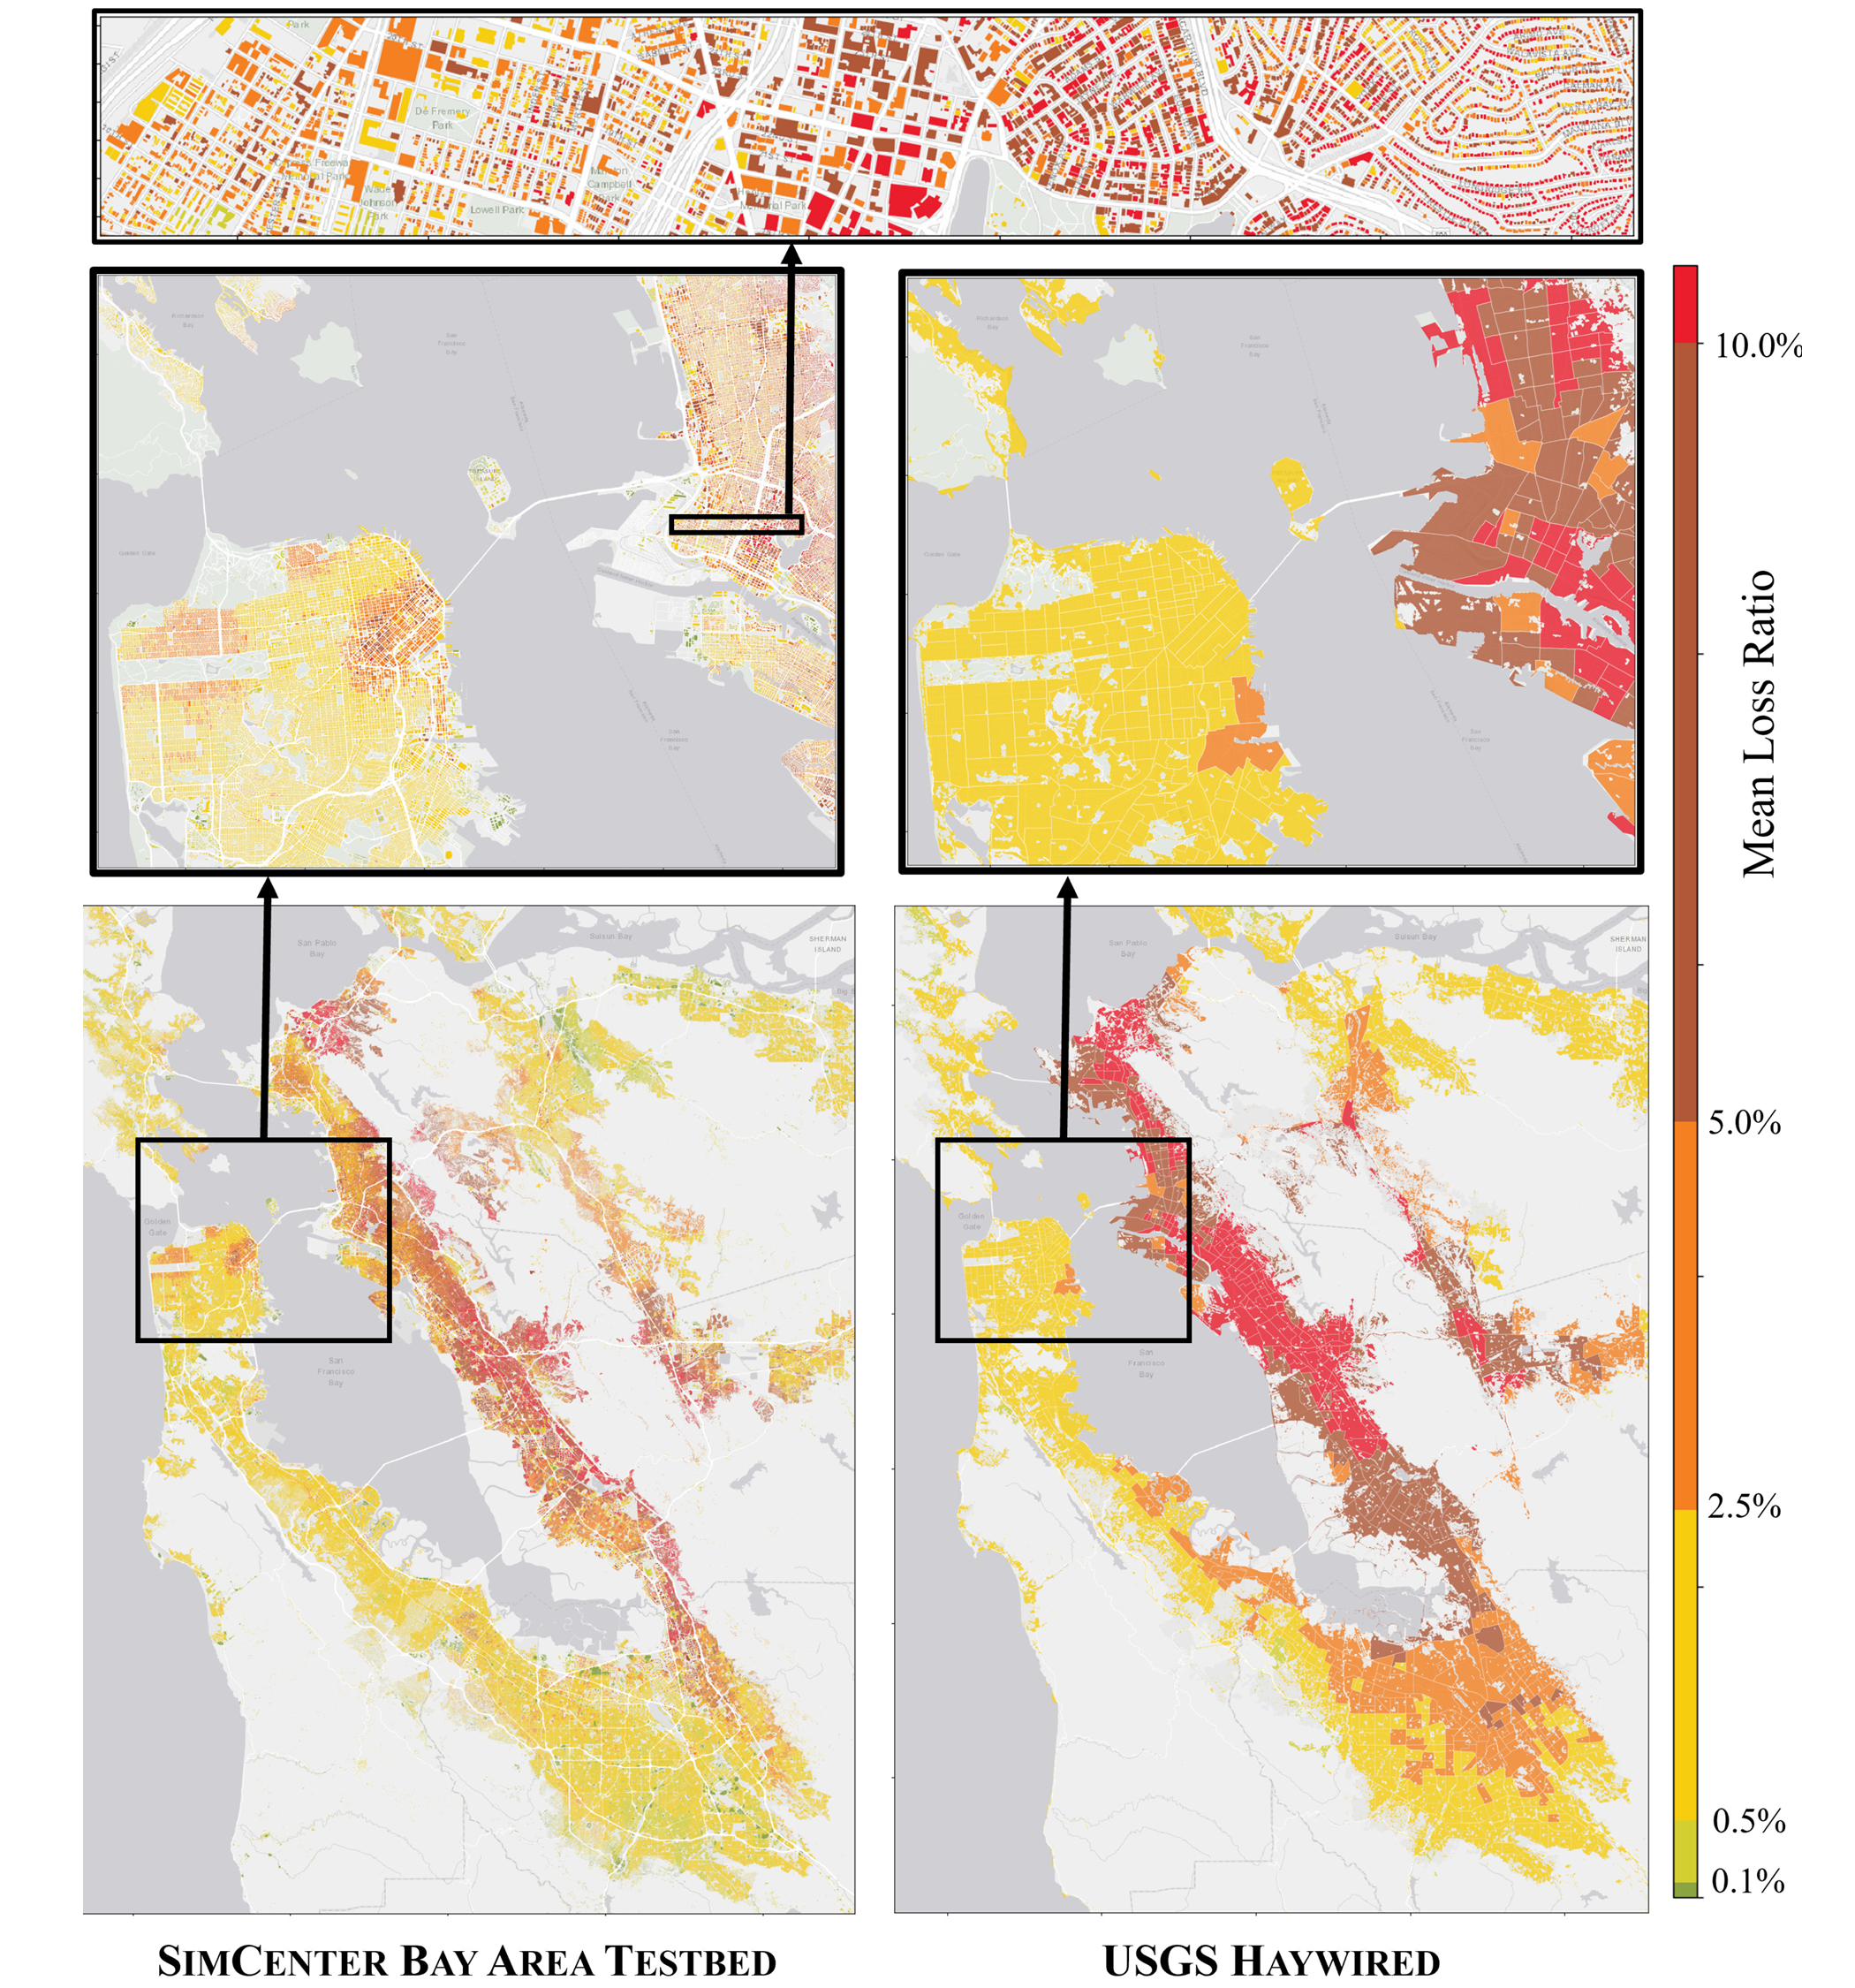
An example of the resulting losses calculated for the Mw 7.0 Hayward scenario are shown in Fig. 1.7.2.1. The color shading represents the loss ratios for each building, calculated as the mean repair costs normalized by the building replacement value. Also shown in the figure is a comparison to the loss ratios reported in the USGS Mw 7.0 Haywired Earthquake Scenario ([Hudnut18]). Exposure and losses in the Haywired scenario were calculated using the HAZUS software. While it is instructive to compare results between the two studies, there are differences in the input data, scope and goals of the studies which are important to keep in mind. As the main purpose of the SimCenter testbed was to assemble and exercise the computational workflow, the models and results in the SimCenter study are preliminary, based on readily available information and implemented by a small team over a couple months. This contrasts with the multi-year multi-investigator Haywired study, whose goal is to inform earthquake planning and preparedness for the San Francisco Bay Area.

Fig. 1.7.2.1 Comparison of building loss ratios from San Francisco testbed - SimCenter (left), USGS-Haywired (right).
Both studies were based on Mw 7.0 Hayward fault ruptures simulated using the SW4 software by the LLNL research group, however, the ground motion time histories are different for the two studies. Epicenters for the two earthquake scenarios are close (East Oakland and San Leandro for Haywired and SimCenter, respectively), but other rupture characteristics are different and the SimCenter ground motions were simulated with more recent versions of the SW4 engine and the USGS geophysical model of the Bay Area. In general, the ground motions used in the SimCenter study are less severe than those used in the earlier Haywired study, and they are in better agreement with expectations based on past earthquake data.
The Haywired study extends over an area including the counties of Monterey, Sacramento, and Sonoma, whereas the SimCenter testbed is limited to the central six counties from Santa Clara to Marin. Due to the larger coverage, the Haywired study had a larger total building population (3.04 M), but the number of buildings in the six central counties in the Haywired study (1.71 M) is comparable to the number in the SimCenter database (1.84M). There are, however, large differences in the total square footage (in the central six counties) and inventory value (replacement values) between the building exposure databases, which make comparisons of total losses between the two studies questionable.
To reduce the influence of the differences in the building exposure values in the two studies, the comparison is limited to damage and loss ratios in the six central counties. The average loss ratio over the entire building population is less in the SimCenter testbed (~ 3% of replacement value) as compared to theHaywired study (~ 5% of replacement value). Nevertheless, as shown in Fig. 1.7.2.1, the geographical distribution of losses shows good agreement between the two. The SimCenter study predicts a larger ratio of non-structural to structural damage (7.5:1 vs. 4.5:1 in the Haywired study) and considerably smaller fractions of the building stock being collapsed (less than 0.01 vs. 0.8%) and redtagged (0.1 vs. 10%). Accordingly, the proportion of buildings that sustain minor or no damage is higher in the SimCenter study compared to Haywired (58 vs. 49%). These results are consistent with the less intense ground motions in the SimCenter scenario, and they highlight the sensitivity of results of such complex studies to inventory data, models for response, damage, and losses, and the input ground motions.
An important distinction between the HAZUS-based Haywired study and the SimCenter workflow simulation is the level of resolution in the assessment and the propagation of various sources of uncertainty throughout the simulation. Whereas the HAZUS-based study aggregates building damage and losses based on census track (zip code) data, the SimCenter workflow has resolution down to the building parcel level, and it can disaggregate losses within a building down to individual components on each floor. This feature, coupled with a detailed description of the probability distributions of damage and losses for each building, can allow urban planners and policy makers to query various possible outcomes–including the rare, but catastrophic ones–of the earthquake scenario. High-resolution results (see upper panels in Fig. 1.7.2.1) provide valuable data for exercises in emergency response, and simulations of post-disaster recovery. In addition, the SimCenter workflow and underlying tools facilitate the combination of models with varying levels of fidelity, where for example, performance for some buildings can be determined using simplified HAZUS type loss functions, while performance for other buildings can be determined using the detailed non-linear structural analysis models and FEMA P-58 component-based damage and loss functions. As such, the high-resolution and multi-fidelity workflow simulations offer increased opportunities to explore questions related to land use planning and zoning, seismic design and retrofit requirements, public policy and administrative initiatives, and other actions to enhance community resilience.
- Hudnut18
Hudnut, K. W., Wein, A. M., Cox, D. A., Porter, K. A., Johnson, L. A., Perry, S. C., et al. (2018). The HayWired earthquake scenario – We can outsmart disaster, USGS, Fact Sheet 2018-3016. Virginia, VA: USGS. doi: 10.3133/fs20183016