2.9. Verification Results
This page summarizes sample results from the testbed runs with three major focuses:
verifying the estimated loss ratios by hand-calculations,
demonstrating the sensitivity study with different hurricane categories, and
illustrating the influence of building properties on the hurricane loss using the observations from the sample results.
2.9.1. Building Inventory
From the entire building inventory, 85 buildings are selected from 5 building classes and 8 built eras. Fig. 3.9.1.1 shows the data distributions of the built year, surface roughness (\(z_0\)), peak wind speed (PWS), and peak water depth (PWD).
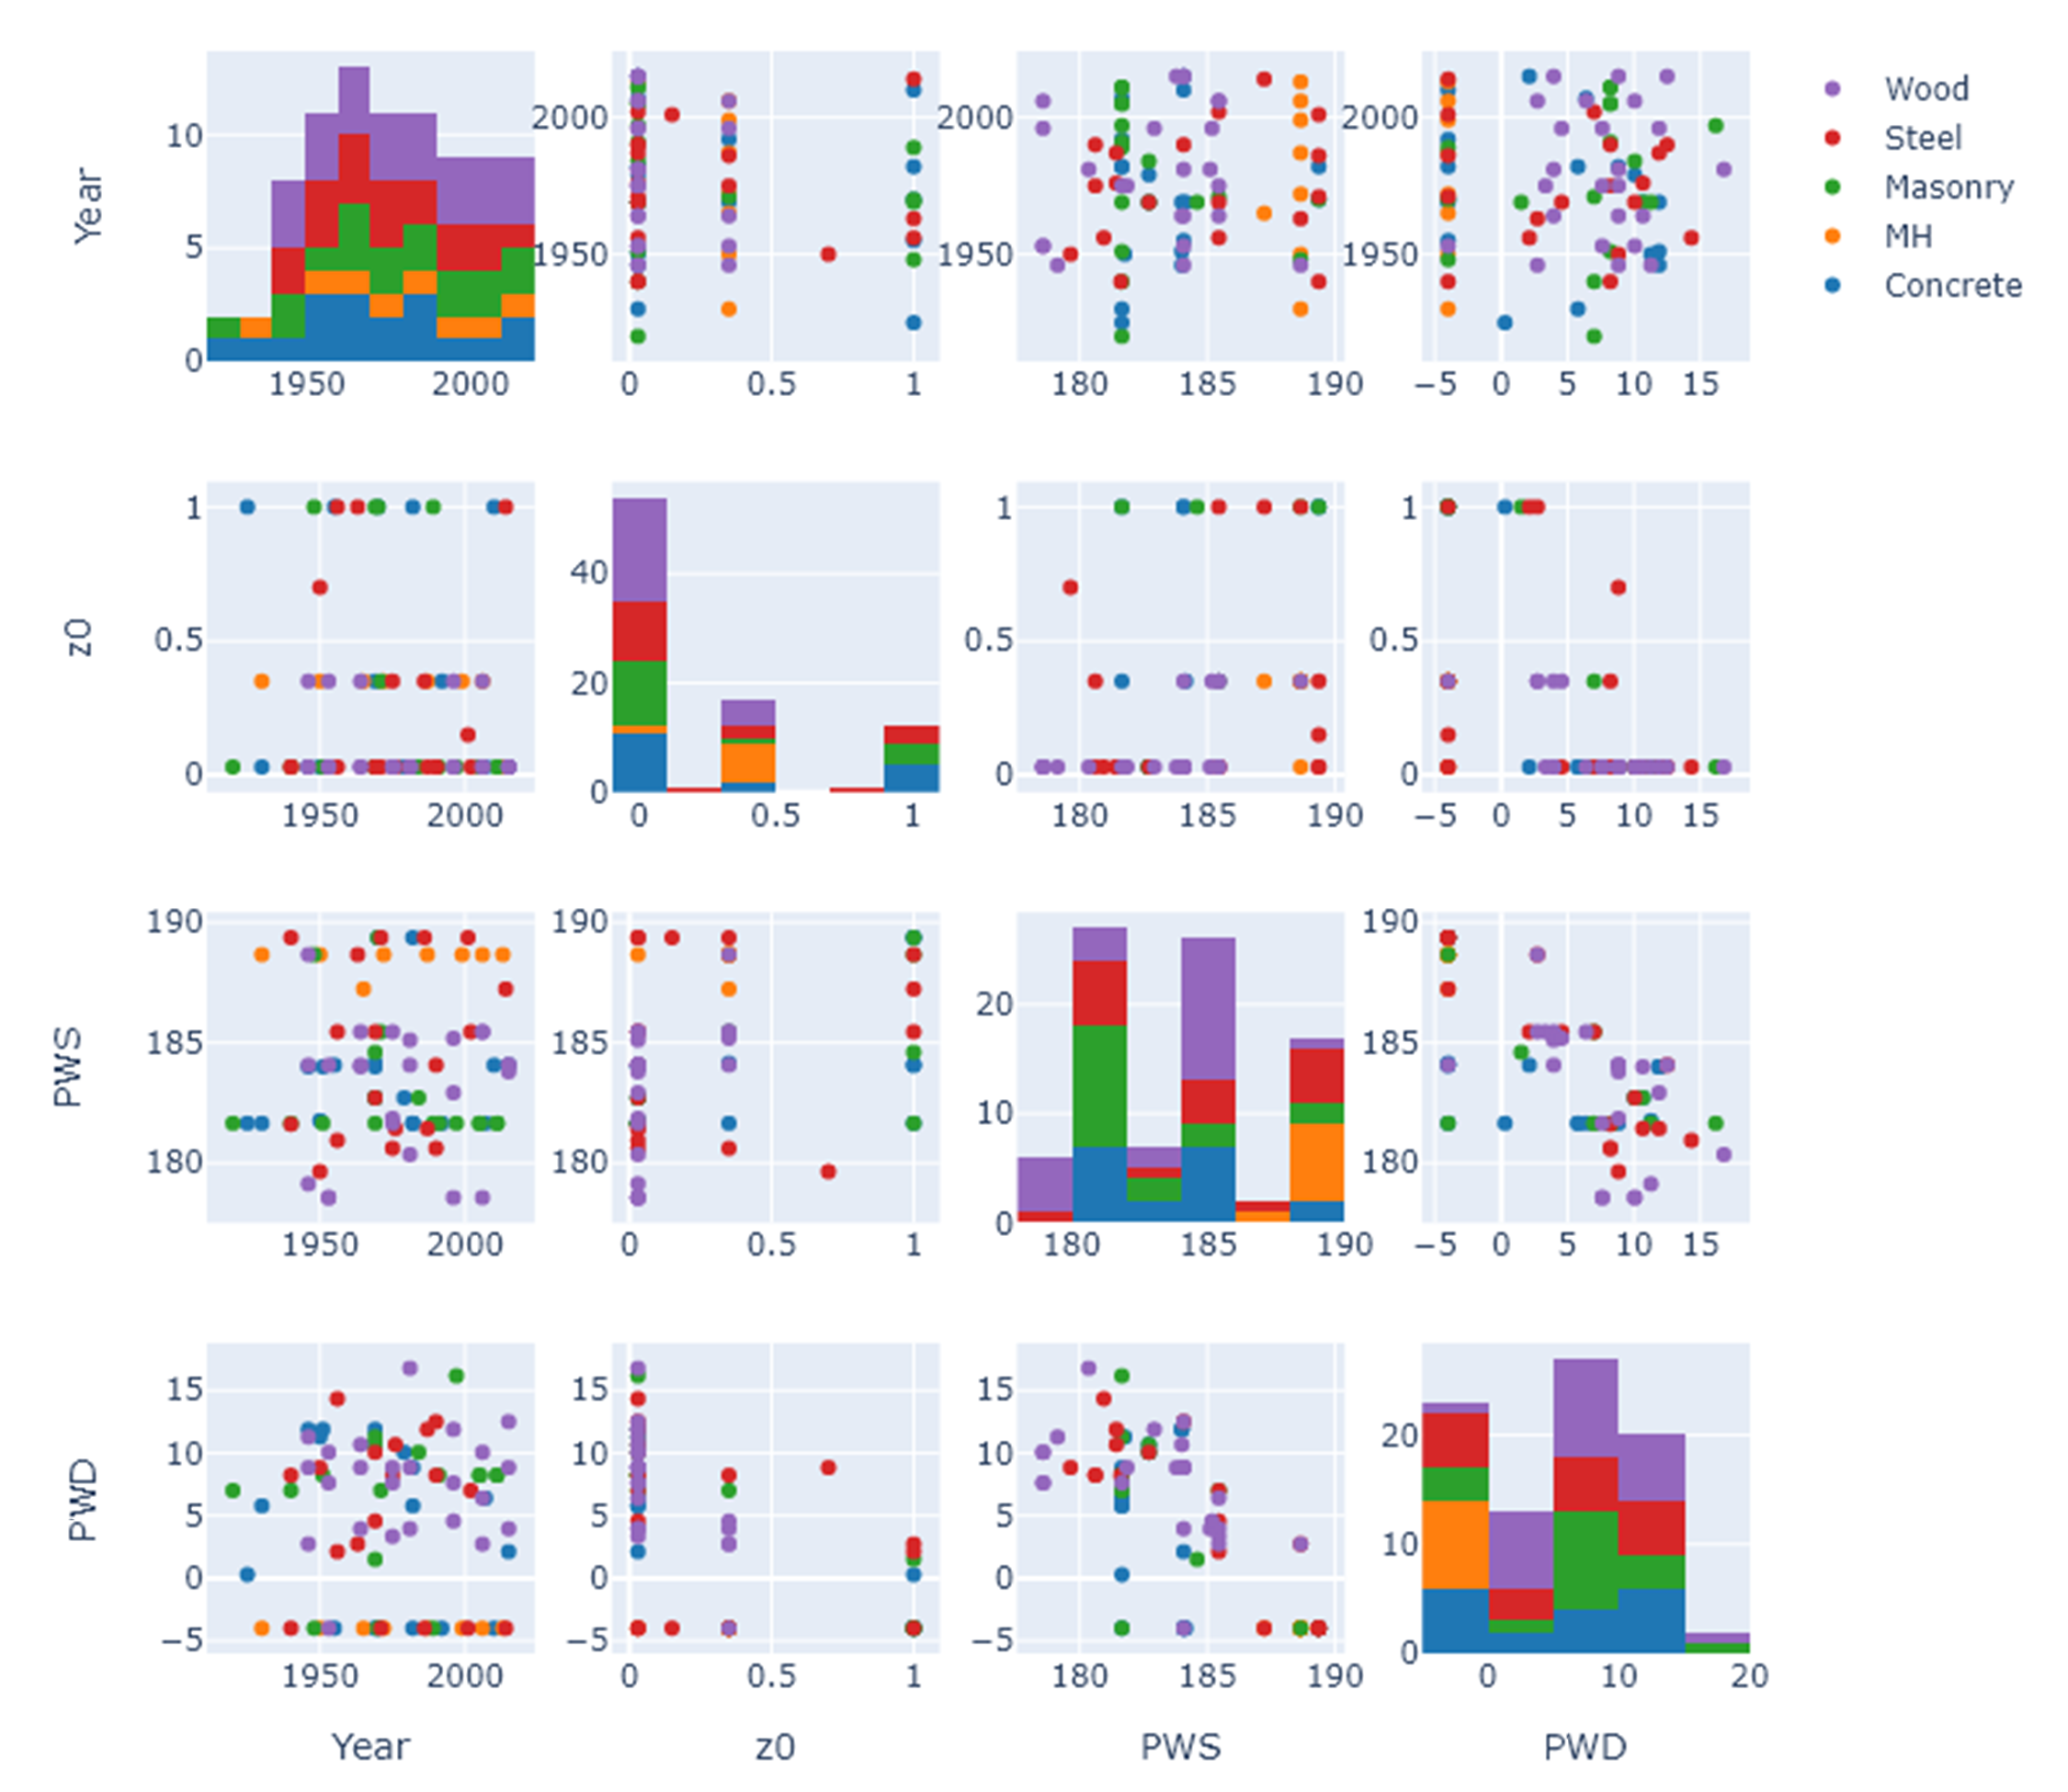
Fig. 2.9.1.2 Scatter matrix of sampled buildings.
2.9.2. Hand Calculation
Hand calculations of wind, flood, and combined losses are conducted using the input building information and intensity measures for the sampled buildings. The calculations are made for all the four hurricane categories:
Fig. 3.9.2.1 compares the hand-calculated loss ratios and the simulated results which are in good agreement. The finite differences seen in the flood loss ratios are due to the random sampling process in estimating the expected loss ratios.
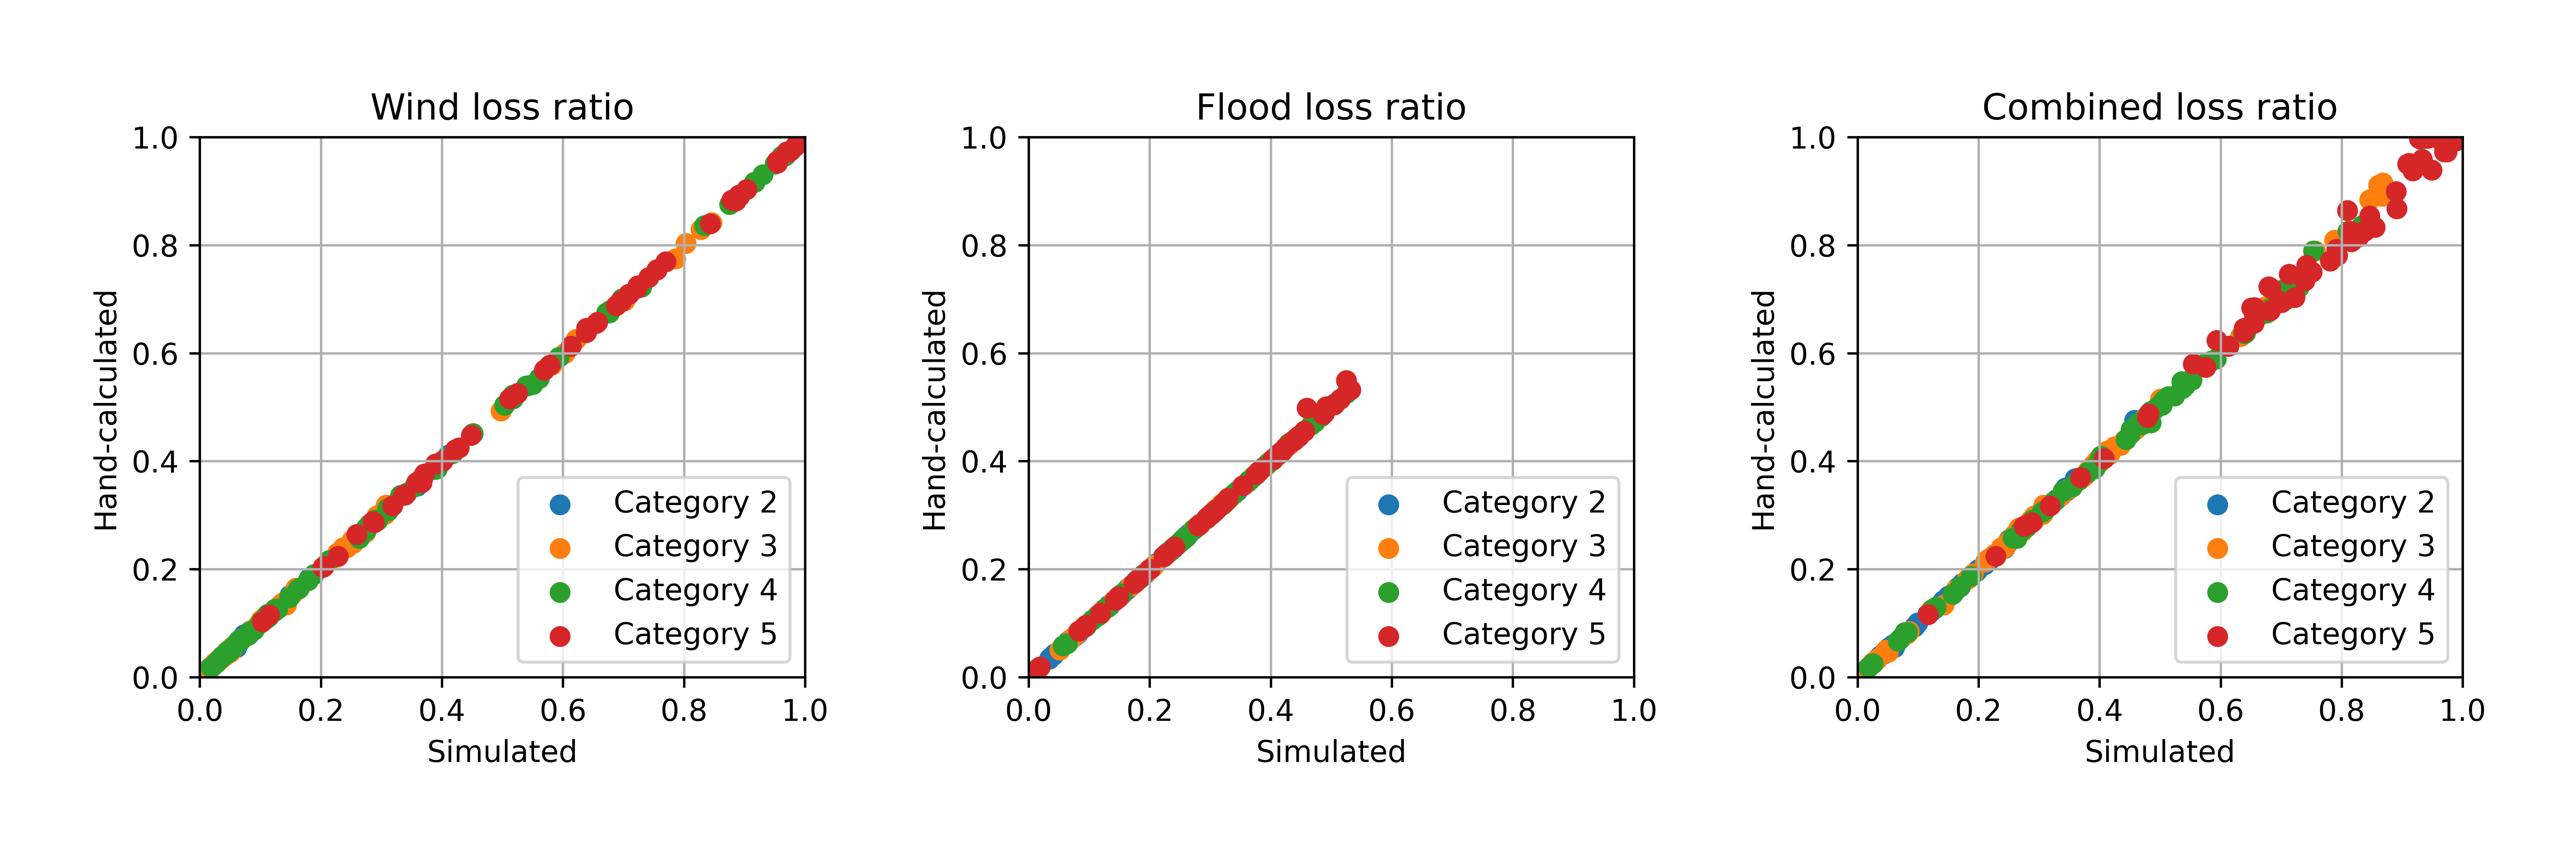
Fig. 2.9.2.2 Hand-calculated results vs. simulated results.
2.9.3. Wind Loss by Building Class and Year
To understand the driving factors that influence the regional loss assessment results. The 85 sampled buildings are grouped into five building classes and the average wind loss values are computed (Fig. 2.9.3.2). Regardless of the hurricane category, concrete, steel, and masonry buildings perform better than wood buildings and manufactured homes on average.
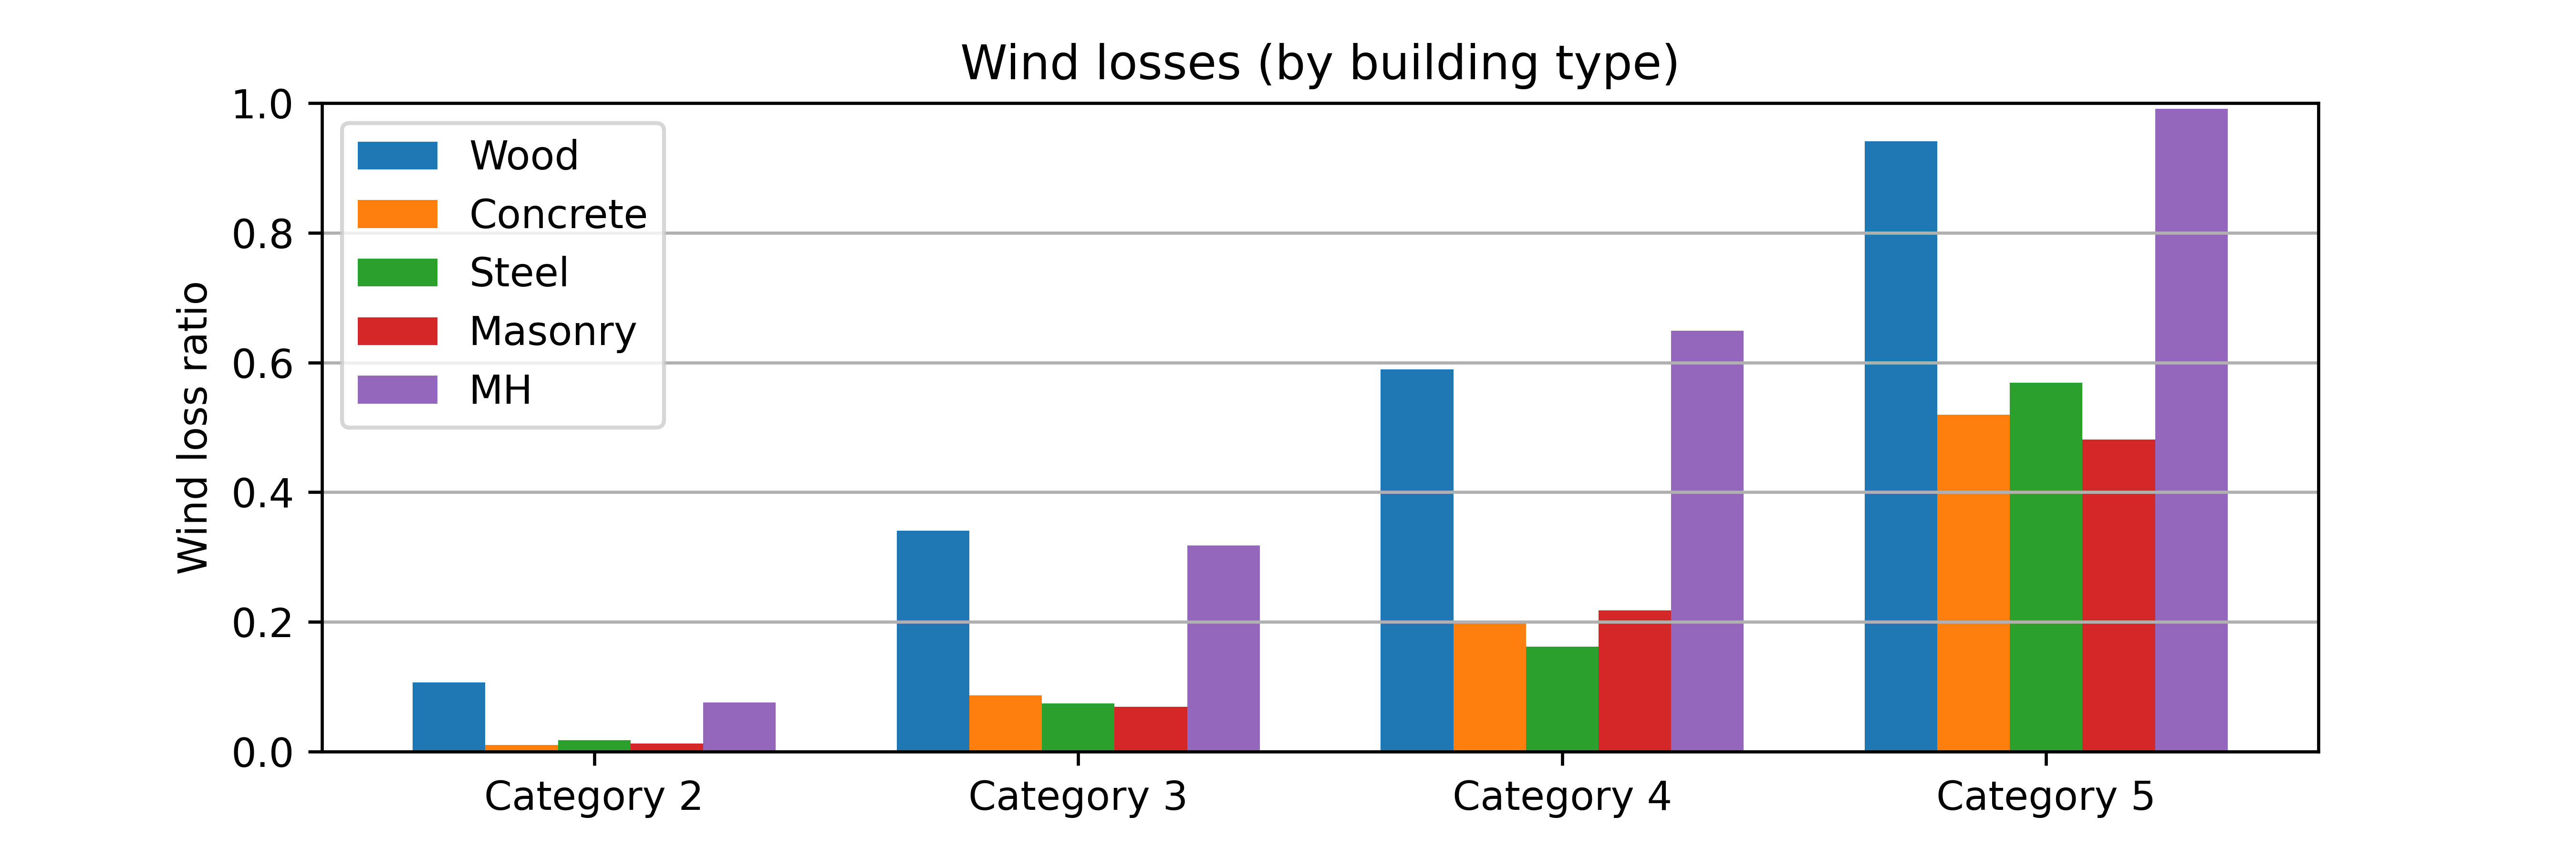
Fig. 2.9.3.2 Average expected wind losses by building class.
To further investigate the influence of built year on the wind loss of wood buildings, Fig. 2.9.3.3 shows the estimated expected wind loss ratios by the year of built. Coupled with the hurricane category effect, in the Category 5 hurricane, the built year does not show as a driving factor, but in the other three scenarios, the wind losses are shown to be related to the built year. The worst cases are seen in 1970s and 1980s, while the building in the past two decades perform much better than the other groups. Note that this comparison is made for the limited sample size in this verification study.
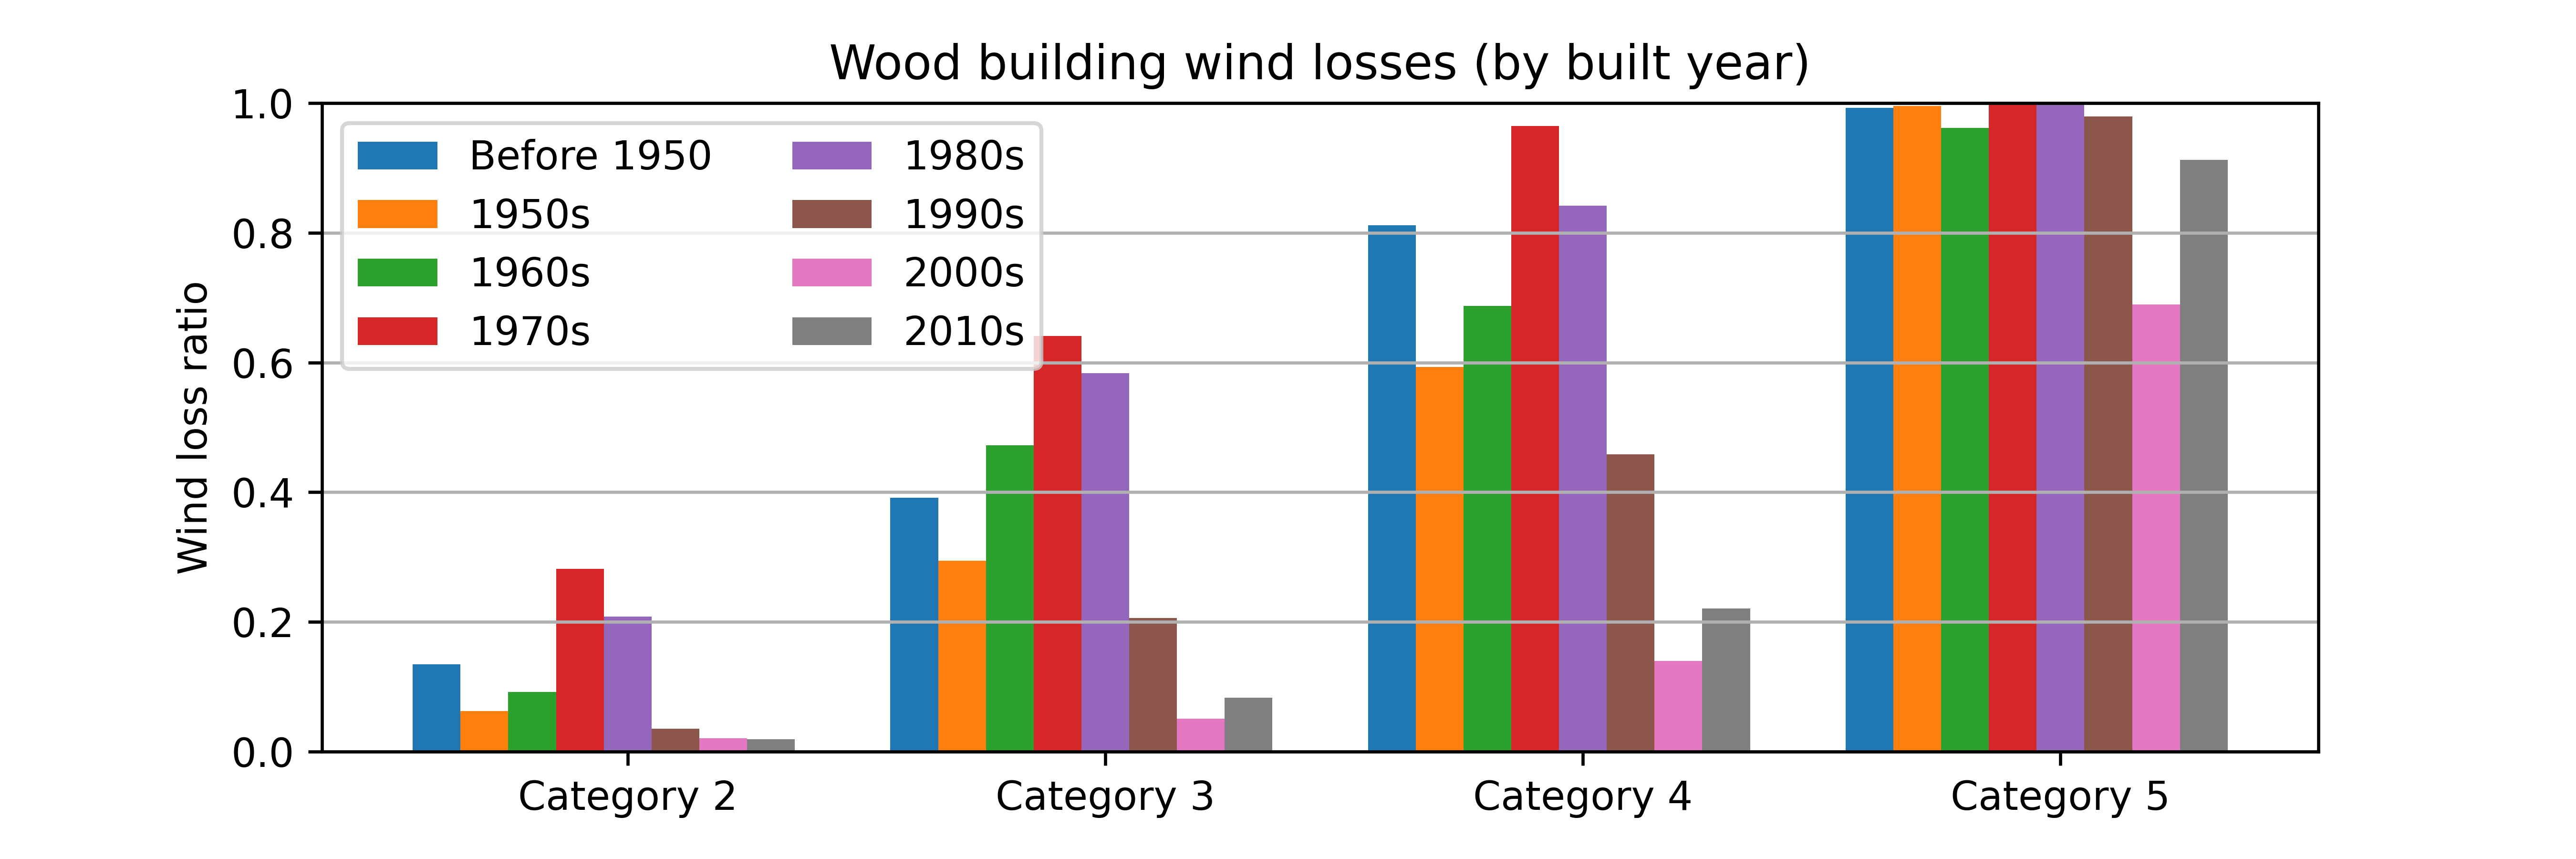
Fig. 2.9.3.3 Average expected wind losses of wood buildings by built year.