3.7. Uncertainty Quantification
Multiple sources of uncertainty are considered in this testbed including: the uncertainty in asset representation, hazard characterization, and damage and loss assessment. For these uncertainty sources, different strategies were implemented in the workflow to quantify their influence. The following sections will introduce the details about each component.
3.7.1. In Asset Representation
As discussed in Asset Representation, the HAZUS Hurricane Technical Manual ([FEMA21]) differentiates buildings based on asset attributes for the subjected hazard type (wind or storm surge). These attributes are the buildings properties or structure features that would influence the resulting damage and loss of the asset under the given hazard. Among these key attributes, some are determined by developed rulesets with more basic building information. These rules are based on the statistics in the available data. Taking the shutters of assets that were built before 2000, the Human Subjects Data indicates that roughly 45% of house owners were likely to apply shutters on some or all of their windows before a hurricane makes landfall. Accordingly, in the asset representation (ruleset), a pre-2000 house has 45% probability to be assigned to have shutters, and 55% probability to be assigned with no shutter. Note that the resulting HAZUS building type is deterministic for each individual sample while the uncertainty induced by different possible attribute options are evaluated via multiple random realizations. Table 3.7.1.1 summarizes the three building attributes whose values are randomly generated in this testbed. Should the rulesets be adapted in the future, the attributes assigned as random variables may change.
Building Attribute |
Basic Attributes |
Example sampling law |
|---|---|---|
Second Water Resistance (SWR) |
YearBuilt, RoofShape |
IF YearBuiltNJDEP > 2000, RoofShape = Gable or Hip, SWR = yes (60%) and no (40%) |
Roof Deck Attachment (RDA) |
YearBuilt |
IF YearBuilt <= 2000, RDA = A (50%) and B (50%) |
Shutters |
YearBuilt, Wind Bore Debris (WBD) |
IF YearBuilt <= 2000, WBD = yes, shutters = yes (45%) and no (55%) |
3.7.2. In Hazard Characterization
Given a specific category of hurricane, the uncertainty of site peak wind speed is considered with the inherent variation in observing the random events at the site (which is usually termed as aleatory uncertainty). For the aleatory uncertainty, as discussed in Hazard Characterization, this workflow adapts a nearest-neighbors method to propagate uncertainty through the workflow, as illustrated in Fig. 1.6.1.1. The peak wind speed values are simulated on a prescribed grid (blue round dots), and for each selected asset location (red square dot), the workflow randomly selects 5 samples of the intensity measure (wind speed) from the 4 nearest neighbors (yellow circles). Note this random sampling is performed along with the multiple realizations from the epistemic uncertainty quantification, so the two uncertainty sources are considered simultaneously.
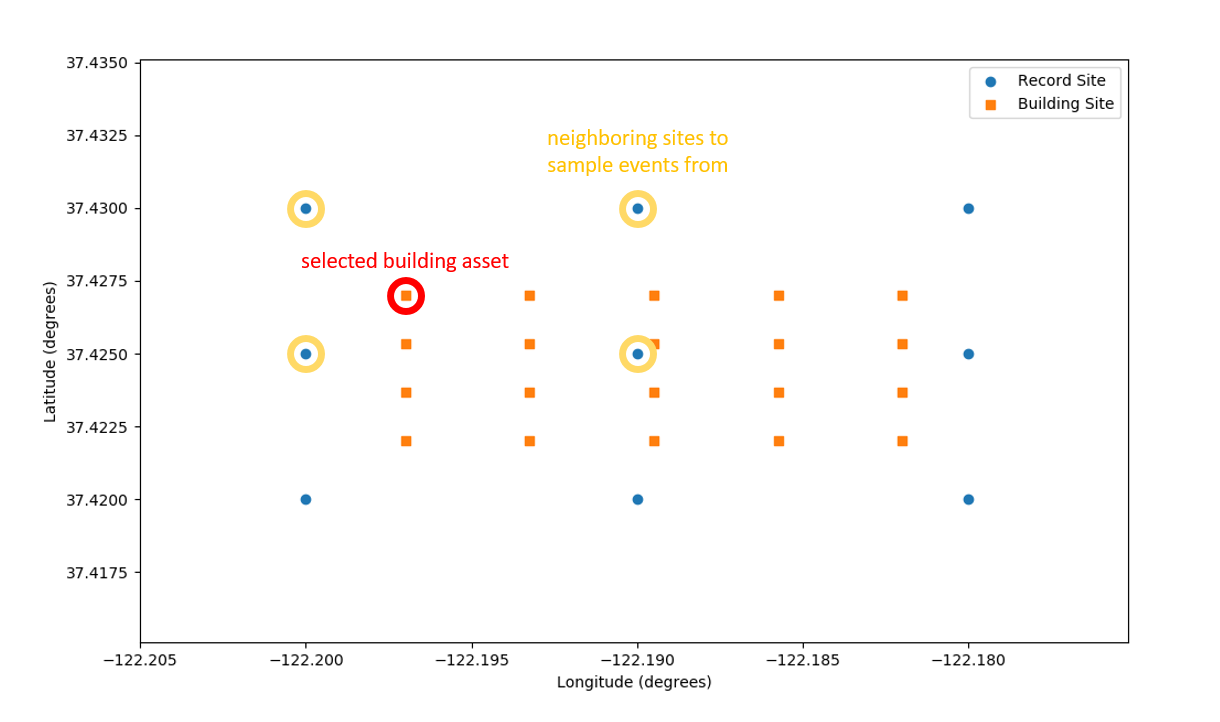
Fig. 3.7.2.1 Nearest-neighbors method for sampling site hazard uncertainty.
3.7.3. In Damage and Loss Assessment
As discussed in Damage and Loss Estimation, the testbed implemented PELICUN (Probabilistic Estimation of Losses, Injuries, and Community resilience Under Natural disasters) to quantify damage (damage states) and loss (in the form of decision variables, e.g., loss ratio). Uncertainty from the hazard characterization step is first considered by the random sampling module in PELICUN to numerically sample the distribution of intensity measures (which are treated as engineering parameters, EDPs in the HAZUS method). Specifically, 1000 samples of combined wind speeds are generated for each asset in this testbed. Second, the corresponding damage and loss models are populated for each asset from HAZUS based on the Asset Representation. As described in Damage and Loss Estimation, the damage models are continuous functions (normal or lognormal distribution functions) fit to the synthetic data by maximizing the likelihood of the observations assuming a Binomial distribution of outcomes at each intensity level in the HAZUS database. Hence, at a given intensity level (a certain wind speed), the damage state and corresponding loss ratio of an asset follow probabilistic distributions, considering all uncertainty in the key properties that can influence the building performance.
- FEMA21
FEMA (2021), Hazus Hurricane Technical Manual. Hazus 4.2 Service Pack 3. Federal Emergency Management Agency, Washington D.C. https://www.fema.gov/sites/default/files/documents/fema_hazus-hurricane-technical-manual-4.2.3_0.pdf