2.11. RES: Results
The Results panel is where the user can review the results of an analysis. Currently, the results post-processor supports output from the following applications:
2.11.1. Pelicun Damage and Loss
Fig. 2.11.1.1 shows the results panel for the Pelicun Damage and Loss application. The results panel is comprised of several docking windows that can be moved, rearranged, resized, and opened and closed by the user. The results panel contains these main docks:
Regional Map Dock: Geographic map of the region. The assets are colored according to their loss ratio. Clicking on an asset will produce a popup showing the detailed information of that asset.
Analysis Summary Dock: A high-level summary of the aggregated losses, repair times, and casualties over a region.
Charts Dock: Graphical representation of the results in three charts:
Casualties: Bar chart showing the casualties in a region accross four casualty severity levels; with 1 being the least severe and 4 being the most severe level.
Economic Losses: Bar chart providing the losses in a region according to damage states, DS, where DS = 1..4, and where DS =1 is the least severe and DS = 4 is the most severe damage state. Moreover, the losses are grouped into losses resulting from damage to structural components, damage to non-structural drift sensitive components, and damage to non-structural acceleration sensitive components.
Relative Frequency Diagram of the Losses: Line chart of the relative frequency diagram of the total losses of each building.
To switch between the charts, the user can click on the Chart Selection Tabs shown in Fig. 2.11.1.1
Detailed Building Results Dock: Table showing the detailed building results. For each building, the table provides the:
Asset ID
Repair Cost
Repair Time
Probability of Replacement
Fatalities
Loss Ratio
The Table Sort combo box, shown in Fig. 2.11.1.1, sorts the table in descending order according to the selected filter, e.g., repair cost.
By default, the results are displayed for all buildings in an analysis. The Subset Selection box allows the user to specify a subset of buildings for which the results will be displayed. A range of buildings is specified with a dash, and multiple buildings are separated with a comma, e.g., 2-8, 9, 13, 15, 21, 34-38. When the Select button is pressed, only the buildings that are specified in the Building Selection box are post-processed and shown in the results.
The Export to PDF file box and button allows for the creation of a PDF containing the regional summary, charts, and building results table for future reference. The user can specify the folder to which to save the results by pressing on the Browse button. By default, the file will be saved as Results.pdf. Clicking on the Export to PDF button creates the PDF in the specified folder.
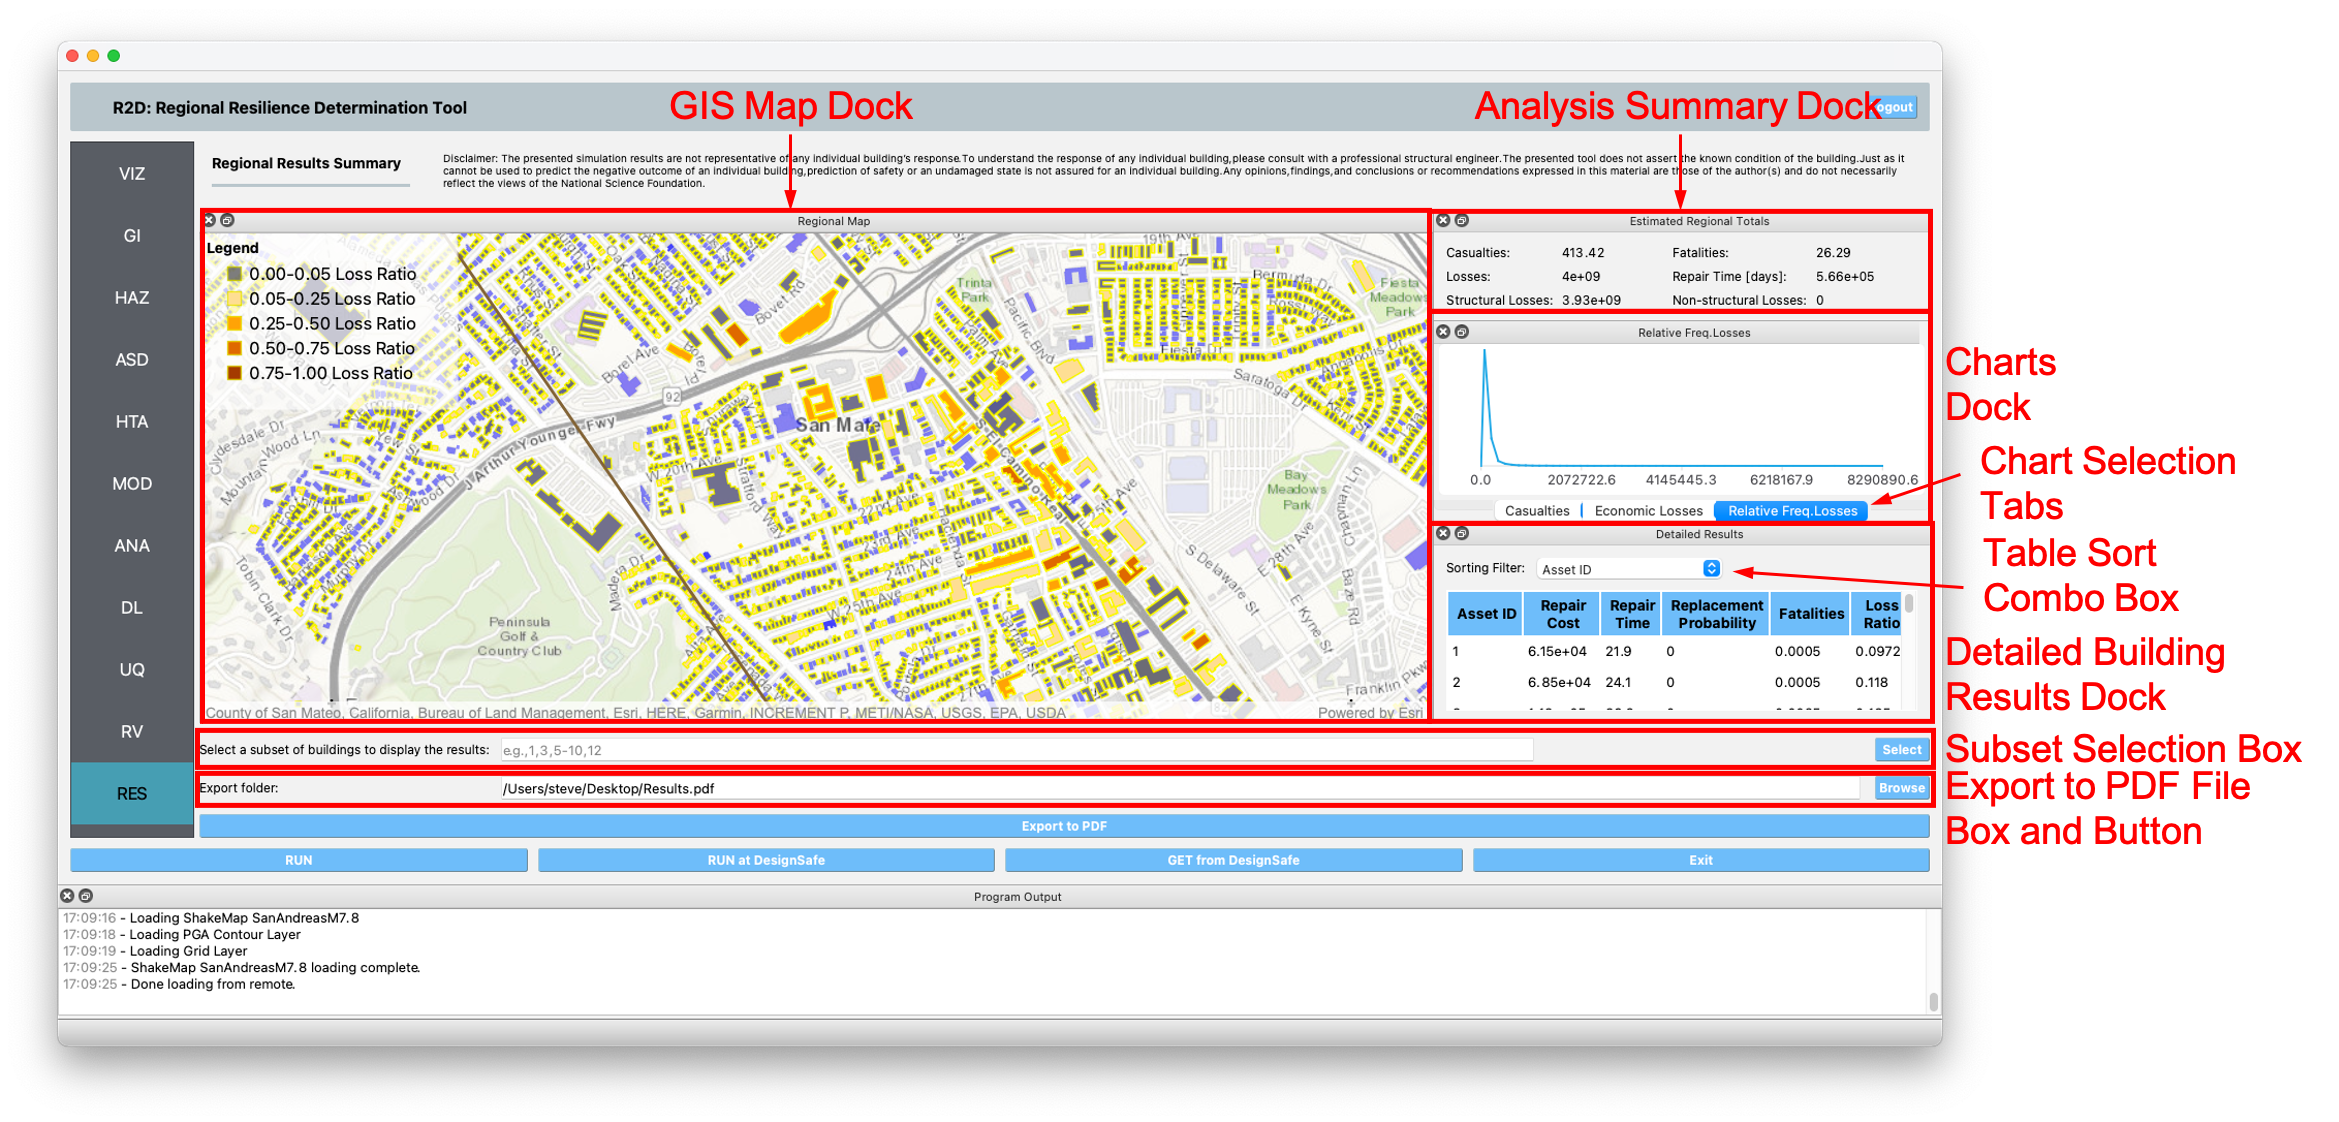
Fig. 2.11.1.1 Pelicun results visualization panel.